Case study: an SEO data warehouse in BigQuery built from five sources (B2B SaaS)
Five SEO data sources (GA4, Search Console, Bing, Clarity, Screaming Frog) in one BigQuery table, and three findings no single tool showed on its own.
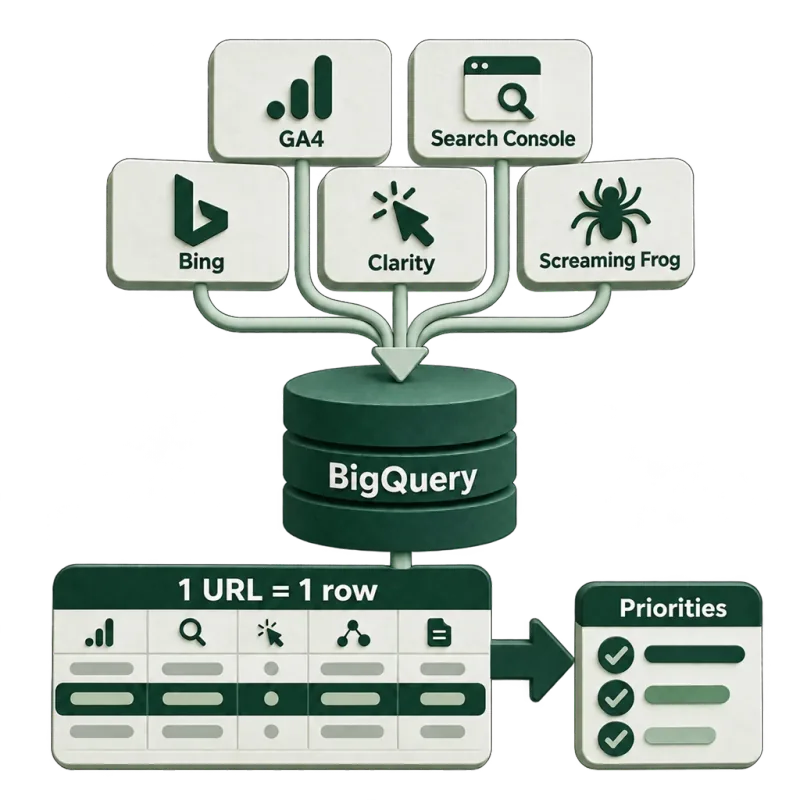
Joined at URL level, five sources surfaced decisions that no single tool could show on its own.
The situation
An international tax compliance software company (VAT, sales tax) with several hundred blog articles and country guides. Organic search is its largest acquisition channel, and the goal is a demo booking or a sign-up.
The data sat in five tools: GA4, Search Console, Bing Webmaster Tools, Microsoft Clarity and Screaming Frog. Each one answered its own question. None of them said which page to work on in the next sprint.
What I built
A BigQuery data warehouse with a staging and a mart layer. GA4, Search Console, Bing and Clarity data load daily. Screaming Frog crawls on a schedule in the cloud, and its exports move into the warehouse automatically. At the center is a golden table: one row per URL, with the data from all five sources beside it.
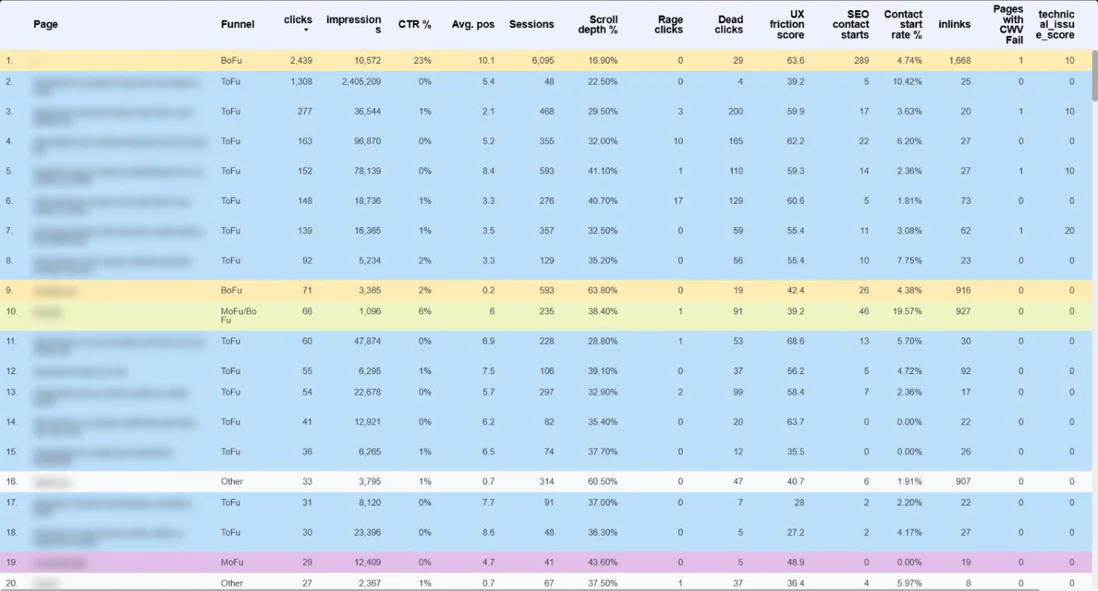
Own measurement · GA4, Search Console, Bing Webmaster Tools, Microsoft Clarity, Screaming Frog and BigQuery · anonymized international B2B SaaS company in a regulated market · September 23 – October 22, 2026.
On top of it sits a seven-page Looker Studio report; each page is described at the end of this article. The warehouse can also be queried directly from Claude, ChatGPT and Gemini through an MCP server. That makes deeper analysis possible without SQL, the kind the dashboard filters can’t handle. For example: which MoFu pages lost clicks in the last two weeks, and which of them have a technical issue or high friction.
Every URL is tagged ToFu, MoFu or BoFu. Conversions count only new users from organic search.
By source:
- GA4: behavior and conversions
- Search Console and Bing Webmaster Tools: demand, position, CTR. Bing is included because several AI search surfaces draw on its index.
- Clarity: scroll depth, rage clicks, dead clicks
- Screaming Frog: technical and content health
Traffic from AI surfaces is tracked as a separate channel.
The scores
The scores in the report come from my own scoring model; none of them is a standard metric.
- Friction score: combines LCP, scroll depth, dead clicks and rage clicks. Each counts in proportion to its actual value, not as pass or fail. A score of 0 means no measurable friction; above 60, several UX problems stack up on the same page.
- Technical score: combines impressions, the size of what’s at stake, with click depth, internal links, LCP, TBT, canonical and status code. A higher score means a fixable technical issue with measurable organic demand behind it.
- Priority score: weights conversions and demand most heavily; friction and technical issues lower it. Sorting by it produces the sprint list.
1. The biggest opportunity was not the best investment
According to Search Console, the biggest untapped opportunity was an article explaining a general ecommerce concept. In one month it got nearly 2.4 million impressions at an average position of 5, with a 0.05% click-through rate. A standard SEO report would put it first: new title, more clicks.
The conversion data showed that the article brought five demo or sign-up starts that month. It’s ToFu content, and most people searching for it aren’t looking for tax software. In the same period, a product page brought 46 starts from roughly a thousand impressions, from close to 20% of its sessions.
This is an extreme case, but it’s exactly what the funnel tag is for. Next to the click opportunity sits what the page is worth to the business, and the priority comes from the two together.
2. The page that converted most had the most friction
The homepage brought the most organic conversions: 289 new-user demo and sign-up starts in a 30-day window. According to Clarity, visitors scrolled to 17% of the page on average, and its friction score was 64. On the report’s scale, a score above 60 means several UX problems stacking up on one page.
Where demand and intent are already there but the experience is poor, a UX fix shows up directly in the conversion rate. GA4 shows that the page converts well. Clarity shows that the experience is poor. That both describe the same page is a single row in the golden table.
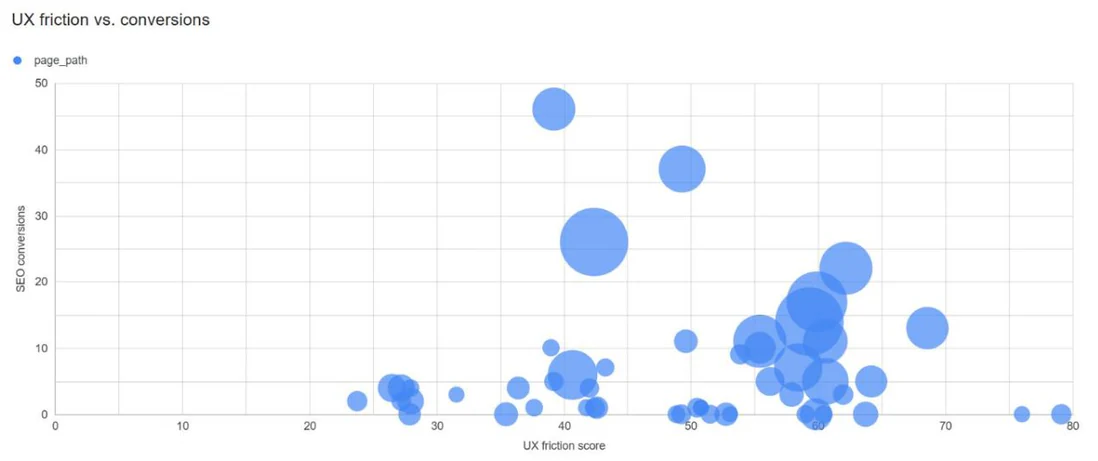
Own measurement · GA4, Search Console, Bing Webmaster Tools, Microsoft Clarity, Screaming Frog and BigQuery · anonymized international B2B SaaS company in a regulated market · September 23 – October 22, 2026.
3. SEO brings more than last click shows
Organic search accounts for 68% of all new-user demo and sign-up starts. In 453 conversions SEO was the only channel, and it appeared on the path in 545. The difference is 92 conversions, about one in six SEO-related conversions. In these, other channels appeared on the path besides SEO, and some of them ended with a direct visit.
On a last-click basis, part of these would go to the direct channel. When the SEO budget is decided, these are exactly the ones missing from the numbers.
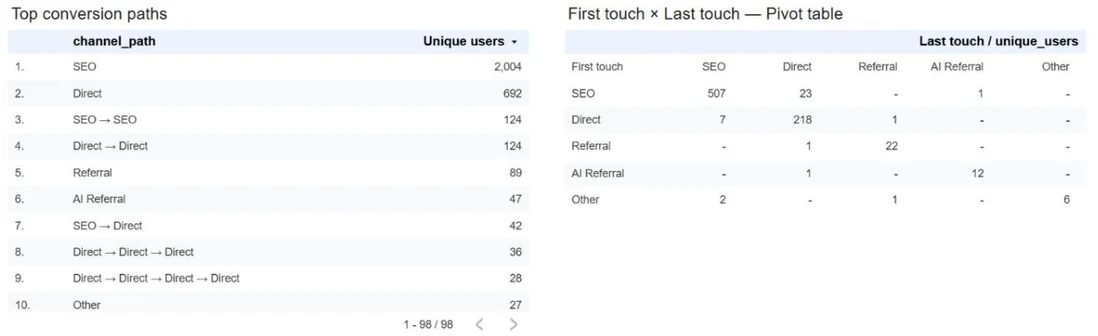
Own measurement · GA4, Search Console, Bing Webmaster Tools, Microsoft Clarity, Screaming Frog and BigQuery · anonymized international B2B SaaS company in a regulated market · September 23 – October 22, 2026.
Why it worked
None of the three findings would have come from a single tool:
- Search Console saw the opportunity. The funnel tag and the conversion data showed what it’s worth.
- GA4 saw the conversion. Clarity showed what holds it back.
- Last-click attribution gave part of SEO’s share to the direct channel. The path data gave it back.
The five sources sit in the same row. Marketing, content and development see the same thing about the same page, so the meeting can be about what to fix first.
What’s in the report, and who it’s for
Each of the seven pages was built for a different role.
- Executive overview (leadership, C-level): the business outcome first, meaning new-user demo and sign-up starts from SEO. Beside it: combined Google and Bing clicks and impressions split into brand and non-brand, the number of keywords ranking in the top 10, conversions by channel, traffic from AI surfaces, and the biggest winning and losing pages of the last two weeks.
- Demand and visibility (SEO, marketing leadership): weekly trend, plus clicks and conversions by market region and country. The query table lists terms where the site is visible but isn’t getting clicks: high impressions with low CTR, positions 4–10, positions 11–20. The list is sorted by estimated impact.
- SEO attribution (marketing leadership, budget decisions): how many conversions have SEO on the path, how many have it as the only channel, and its share. Beside the most common conversion paths sits a first touch × last touch table.
- Landing pages (SEO and marketing team, sprint planning): one row per page, from impressions to conversion. It holds demand, traffic, scroll depth, friction, conversion rate, internal links and the technical score. It filters by funnel stage, and sorted by priority score it gives the next sprint list.
- Content (content team, SEO): Screaming Frog crawl data together with Search Console. It shows title, meta description and H1 status, word count, readability and internal links. A separate list shows the pages with the most missed clicks relative to their impressions.
- UX and friction (UX, design, CRO): a bubble chart where each page is a point, with friction on the horizontal axis and SEO conversions on the vertical. Each page also gets a diagnosis label, such as dead clicks or low scroll depth. Two separate lists collect pages that rank well but get weak visits, and articles that are seen often but read little.
- Technical health (developers, technical SEO): indexability, click depth, internal links, canonical, LCP, TBT and status code, with impressions next to every page. The score puts first the technical issues that have real organic demand behind them.