Flat for four months, then a third higher
A 14,000-product ecommerce catalog, reworked over six months. Traffic stayed flat for four, then climbed a third. What the shape of the line actually shows.
Continuous optimization looks like nothing for four months — then the line moves and keeps moving.
| 475 → 600+ | Weekly organic clicks | flat for four months, then climbing |
|---|---|---|
| 0.94% → 1.14% | Organic conversion rate | Jun–Aug 2026 vs. Jun–Aug 2025 |
| ~14,000 | Products in the catalog | roughly 80% reworked |
Own measurement · Search Console, Web search, weekly · conversion rate from GA4, organic sessions.
In short: A Hungarian agricultural ecommerce business sells more than 14,000 products through several hundred category pages. At that size, optimizing pages one by one for search doesn’t work. In March 2026 I started an ongoing program instead of a one-off audit. Over the following months roughly 80% of the product catalog and 80% of the category pages were reworked. Organic traffic didn’t move immediately. It started climbing about four months in, and has kept climbing since.
The problem with a 14,000-product catalog
Most SEO advice assumes you can sit down with a page, work out what it should say, and fix it. That falls apart at scale. With 14,000 products and several hundred categories, you cannot make individual decisions about every URL, and you shouldn’t try. Some of those pages will never be searched for. Others carry most of the site’s commercial potential.
The site had the usual symptoms of a catalog that had grown faster than its structure:
- inconsistent search targeting across the catalog, with no shared logic behind titles and descriptions
- a category structure built around how the business thinks about its products rather than how customers look for them
- technical and page-speed issues
- strong seasonal demand, typical of agriculture, which makes any single before-and-after comparison unreliable
The goal was never to rank for a handful of keywords. It was to build a structure that could keep improving, and a process for deciding where to work next.
What I actually did
1. Research before changes
The first month went into finding out where the opportunity was, not into rewriting anything. I looked at existing search performance, keyword demand, current rankings, the category structure, competitors, technical issues and site speed.
That produced the thing the project needed most: an order of priority. With 14,000 products, deciding what not to touch first matters as much as deciding what to fix.
2. Category pages first
Category pages carried the largest untapped opportunity, and that’s usually the case in ecommerce. Someone searching for a product type rather than a specific product lands on a category page, and that group is far larger than the group who already know the exact product name.
About 80% of the category and subcategory pages were eventually reworked. Depending on the page, that meant new search targeting, page titles, headings, category descriptions, internal linking, naming, and structure.
In some cases rewriting the existing page wasn’t enough. Where the research showed people searching for product groups the site didn’t represent at all, new categories were created. Where the existing grouping didn’t match how people search, it was restructured.
3. Product pages at scale
Roughly 80% of the product catalog was reworked, which means SEO changes eventually reached more than 10,000 product URLs. Titles, headings, meta descriptions (the summary line that appears under a result in Google), product descriptions, keyword relevance, category placement and page structure.
The point was to make each page clearer, both to a search engine and to someone deciding whether to buy. Longer product descriptions are easy to produce and rarely help.
4. Structure, not just text
Some of what the research surfaced couldn’t be fixed by rewriting anything. If customers are searching for a product group that has no page, no amount of editing creates one.
So the category structure kept being refined alongside the content work: new search-driven categories, restructured existing ones, better product-to-category relationships, missing subcategories filled in.
5. Technical foundation
Content work was supported by technical improvements, mainly around site speed and removing issues that made the site harder to crawl. This part is unglamorous and rarely produces a dramatic chart, but it determines whether the rest of the work gets picked up.
Why results took four months to appear
This is the part clients find hardest to accept, so it’s worth being precise about it.
Changes weren’t deployed all at once. The process ran as a loop: research, prioritize, implement, measure, iterate. New groups of pages were optimized month after month, and Search Console data guided what came next.
Two things follow from that. First, a page optimized in March had months to be recrawled and reassessed before a page optimized in July even existed in its new form. Second, March 1 marks the start of the program, not the point where the work was finished.
In practice, Google began reprocessing updated pages within about two to four weeks. Meaningful movement in rankings and traffic took roughly three to four months.
The traffic chart shows exactly that shape. Weekly clicks stay flat through spring, at around 475 a week, with no visible jump after the program starts. The rise begins around late June and continues from there, reaching over 600 weekly clicks and nearly 18,000 weekly impressions by August.
That flat spring section is not a problem with the work. It’s what continuous optimization looks like before the accumulated changes have been processed.
Results
Over the twelve months to August 2026 the site recorded 8,100 organic clicks from 204,000 impressions, at a 3.9% click-through rate and an average position of 8.7. Impressions are the number of times the site appeared in search results at all; CTR is the share of those appearances that turned into a visit.
Those totals cover the whole twelve-month window, and the first half of it predates the SEO program. They describe the scale the site operates at, not the result of the work.
The result is the shape of the line. Weekly clicks sit flat from the new year through spring, at around 475 a week. From late June they climb steadily, and by August the site is running at over 600 clicks — close to 650 at the peak — and nearly 18,000 impressions a week, the highest levels anywhere in the twelve-month window.
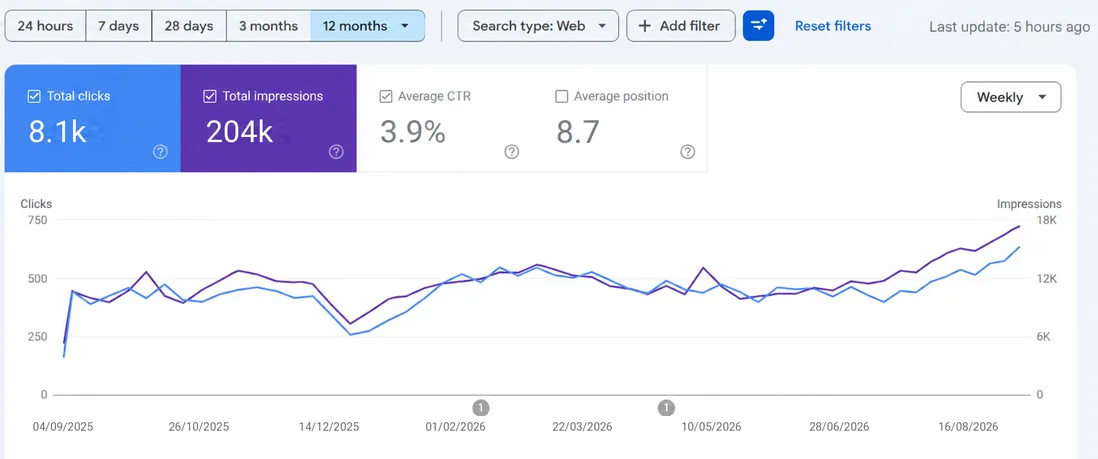
Own measurement · Search Console, Web search, weekly, September 4, 2025 – August 16, 2026.
Conversion rate
Comparing June–August 2026 with the same three months of 2025, the organic conversion rate rose from 0.94% to 1.14%. Same season, same catalog, one year apart — which is the only comparison that means anything on a site where demand swings with the farming calendar.
I’m not claiming this as a direct result of the SEO work. Conversion rate moves for many reasons, and several things changed on the site during those months. What the number does show is that the additional organic visibility didn’t dilute traffic quality, which is a common outcome when a site chases volume. More visitors arriving and a higher share of them buying is the pattern you want.
There is also a plausible mechanism. When a product page states clearly what the item is for, what it suits and how it differs from the similar-looking product next to it, fewer visitors bounce back to the results page to keep looking. That is one of the ordinary reasons conversion improves after content work, and it’s consistent with what happened here.
Why revenue isn’t the headline number
Organic revenue increased over the period. I’ve left it out of the headline results anyway.
Agricultural ecommerce has pronounced seasonal demand, and revenue is also affected by pricing and product mix, neither of which had anything to do with this project. Attributing a revenue increase to SEO in that environment would be overstating what the data supports.
The metrics above sit closer to the work itself, and the conversion rate in particular is far more stable across a season than an absolute revenue figure.
What the project actually demonstrates
The difference between doing SEO optimizations and running an SEO system.
On a site with 14,000 products, sustainable organic growth was never going to come from rewriting a few important landing pages. It required a repeatable way to find opportunities, decide which ones justified the work, implement at scale, and use performance data to choose what came next.
The result is a catalog where thousands of pages now work harder than they did, and a process that keeps finding the next thing worth fixing.