When site speed stopped being a technical detail
An ecommerce store where load time and completed purchases correlated at −0.81 — strong enough to move speed out of the backlog and into the revenue conversation.
Speed isn’t a technical score. On this site it was a measurable share of revenue — and nobody could see that until two datasets were joined.
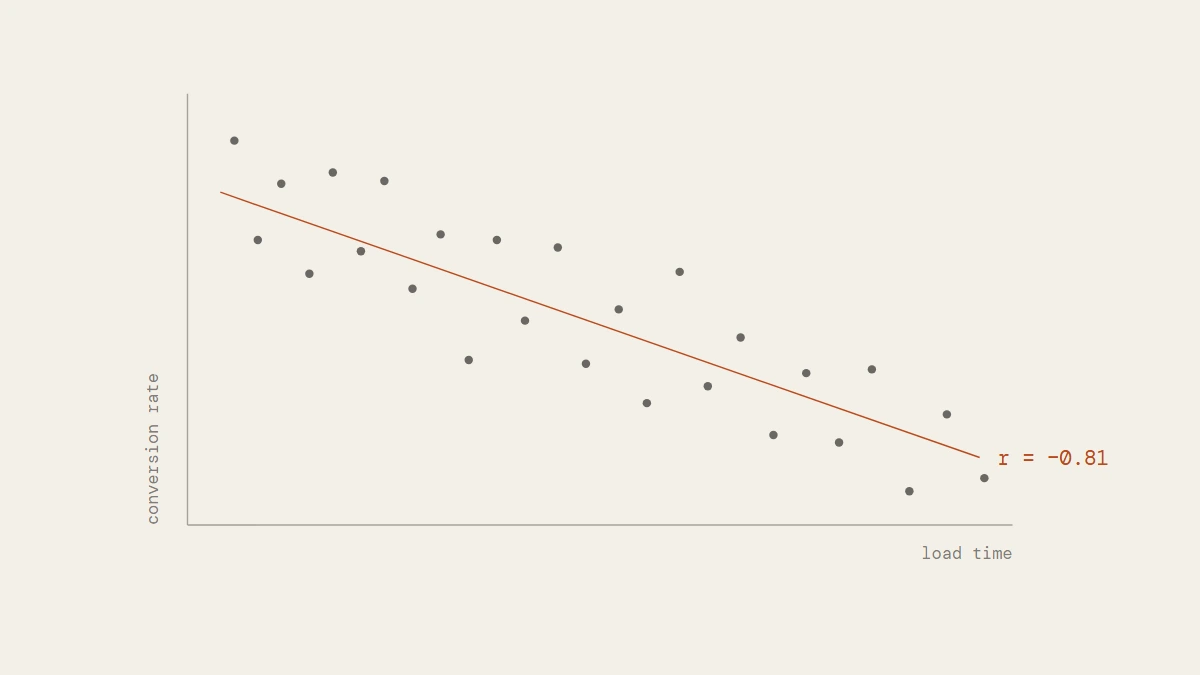
Own measurement, GA4 → BigQuery.
| ~5 s → ~3 s | Average mobile load time | roughly 40% faster |
|---|---|---|
| 2.60% → 2.73% | Conversion rate | ≈ +5% in relative terms |
| r = −0.81 | Correlation between mobile load time and conversion rate | negative because slower is worse |
Own measurement · GA4 → BigQuery, mobile sessions, six-month window · anonymized client project.
The situation
I worked on SEO and UX for a high-traffic Hungarian hardware ecommerce store. I’m not naming the brand, but the situation was familiar: strong organic traffic, many product pages, heavy mobile usage, and a business goal that wasn’t “make the site look nicer”.
Nobody told me which task had to deliver the improvement. Several directions would have made sense — technical work, content, internal linking, category pages, structured data. I wanted to start where the effect would be visible in the business, not just in a tool. That’s why speed became the focus.
Why it was invisible
The site worked. It wasn’t broken, it wasn’t unusable, and at first glance it didn’t look dramatically slow. In practice that’s more dangerous than an obviously broken site: if something is visibly wrong, the decision to fix it is easy. If a site is “just a bit slower than it should be”, performance slides down the backlog behind campaigns, promotional pages and product changes.
So we didn’t start with optimization. We started with measurement.
How it was measured
The goal wasn’t to look at speed as a standalone metric, but to connect it with behavior and conversion. Core Web Vitals-style values were collected in Google Tag Manager and sent to GA4 — page load time, content load time, DOM interactive time, server response time. From GA4 the data went into BigQuery, where it was cleaned, extreme values handled, and sessions grouped by speed.
That moved the conversation away from PageSpeed scores toward a more useful question: did users who experienced slower loads buy at a lower rate?
They did. A linear regression showed a strong relationship on mobile: r = −0.81.
I wouldn’t present that as proof of causation. Correlation isn’t causation, and one regression doesn’t settle a business question. But you rarely need perfect proof for the first decision — you need a signal strong enough to justify the priority. This one was.
What the baseline looked like
Average mobile load time was around 5 seconds. That may not sound disastrous; in ecommerce it’s a lot — especially on mobile, and especially on listing and product pages, where users make many small decisions in sequence rather than one big one.
Baseline conversion rate: 2.6%. Comparing speed segments, faster sessions converted better. Not every bucket behaved like a textbook example — real data rarely does — but the direction was unambiguous.
What changed
Speed is rarely solved by one trick. The result came from four layers.
Images. The problem wasn’t that the images existed; it was that many weren’t served in the right size or format. We generated multiple sizes from each upload and served the version matching the device, in WebP and AVIF with fallbacks. On mobile this alone was noticeable.
Caching. On a custom platform this is never “enable a plugin”. Resource-heavy queries were cached at application level; OPcache and APCu handled the server side; a CDN layer served static assets; browser cache rules were cleaned up. The hard part wasn’t enabling cache — it was doing it without damaging business logic. Prices, stock and cart data had to stay fresh. The work was separating what could safely be cached from what must never be.
Render-blocking code. If something isn’t needed for the first render, it shouldn’t block it. Unused CSS reduced, non-critical JavaScript deferred or loaded conditionally. Minification was added too, though I wouldn’t overstate it — the gains came from images, caching and blocking resources.
Keeping it. We didn’t treat this as a one-off project. A new banner, script or tracking pixel can undo the work in a fortnight if nobody watches the performance impact. Less interesting to talk about; often decides whether the improvement lasts.
What it was worth
Load time fell from ~5 s to ~3 s — roughly 40%. Conversion moved from 2.60% to 2.73%, about 5% in relative terms.
At first glance 2.60 → 2.73 doesn’t look dramatic, which is exactly why I’m careful with percentage-point thinking. On a site with 500,000 monthly sessions and a 35,000 HUF average order value, that difference is roughly 22.75 million HUF in estimated additional monthly revenue. That’s a publication-friendly estimate, not an accounting figure — but it’s the number that made the priority obvious.
What I took from it
Many people still treat speed as a technical task. It’s partly that. But the user doesn’t see a PageSpeed score — the user experiences waiting: the list loads slowly, the image arrives late, the page shifts as they’re about to tap, the cart button doesn’t respond when expected. Individually small; during a buying journey they add up.
The result that mattered wasn’t 5 seconds becoming 3. It was that speed got translated into business language. Not “the score is bad” — that rarely moves an organization — but “the slower experience is measurably connected to a lower conversion rate, and improving it has a revenue effect”. That’s a different conversation.
It also wasn’t a one-person project. My role was to connect the business problem, the SEO and UX considerations and the measurement data into a development priority that made business sense. The implementation needed the internal development team, because these decisions — what can be cached, what can’t, where the real risk is, what’s still in the system because nobody questioned it — can’t be solved from outside by dropping an audit on someone’s desk.
That was the lesson: speed work succeeds when data, search, UX and development are working on the same problem rather than running as separate topics.
What to check on your own site
- Are your Core Web Vitals values in your analytics at all, or only in PageSpeed?
- Can you segment sessions by speed and compare conversion between the segments?
- Are your images served in the size the device actually needs, and in WebP or AVIF?
- Does anything block the first render that isn’t needed for it?
- Is there anyone who notices when a new script makes the site slower?